Healthcare Evaluation Data (HED)
Online benchmarking solution designed for healthcare organisations.
HED has developed a flexible and interactive tool with numerous
dashboards and in-depth modules.
The system is web-based and designed to deliver intelligence to enable healthcare organisations to drive clinical performance improvement and financial savings.
Healthcare Evaluation Data (HED)
Driving Quality and Efficiency

The HED Suite
allows healthcare organisations to utilise analytics which harness HES (Hospital Episode
Statistics), national inpatient and outpatient and ONS (Office of
National Statistics) Mortality data sets.

Interactive System
intuitive and easy to use. The reports are updated monthly by a dedicated quality support team, providing relevant, timely and robust data.

Continual Evolution
The system has a continual evolution of indicators. Our highly regarded team continually shapes and develops national and international methods of monitoring clinical quality using
routinely collected datasets.

Powerful Dashboards
Intuitive and responsive, offering graphics that are fully customisable to each user.

New Metrics
HED Analysts constantly
develop new metrics to
match current trends.
Build your own dashboards in HED using our flexible and intuitive platform which can be used on multiple devices.
HED DASHBOARDS
HED Dashboards allow healthcare organisations to quickly measure performance, monitor outcomes and identify opportunities for further improvement.
Designed in collaboration with our customers, HED offers a range of dashboards covering a variety of measures.
HED Dashboards are intuitive, easy to use and can be accessed on
multiple devices.
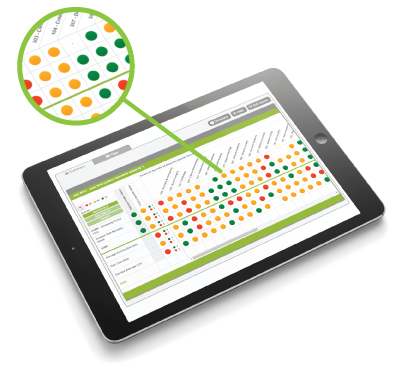
HED Tiles
Customisable to each user’s role, this dashboard features numerous indicators which can be presented in a variety of formats, even utilising a hospital’s divisional structure to organise treatment specialties.
HED Tiles is a straightforward dashboard allowing organisations to easily identify specific opportunities to improve clinical performance.
Indicator Summary
Select from over 30 indicators to map a trust’s position on a live table builder. Indicator summary offers hospitals the ability to benchmark against local trusts and recommended peers. Further functionality allows users to investigate indicators by specialities and admission methods.
HEDlines Indicators
Visually enticing and covering a broad array of indicators, the HEDlines dashboard allows users to view a variety of measures on screen with the additional benefit of downloading them in multiple formats.Tailored versions are available for specialist trusts to ensure clinically relevant measures.
NHS Choices
Displaying measures covered by NHS choices, this dashboard allows organisations to monitor their performance. Measures are presented clearly, allowing users to quickly identify areas of concern and investigate deeper via relevant modules.
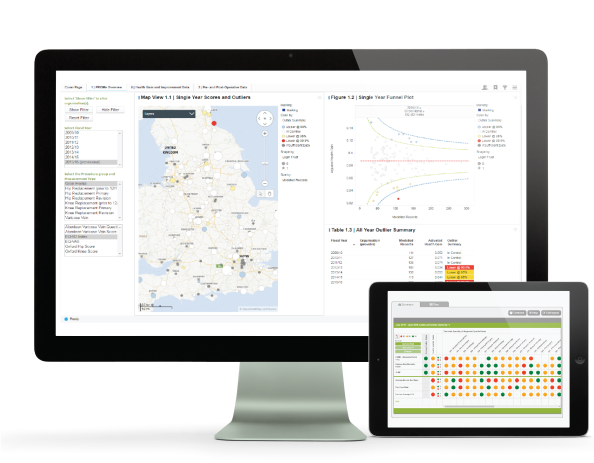
CLINICAL QUALITY
Clinical Quality monitoring within HED has been developed in collaboration with consultants, nurses and healthcare managers to support the continued observation of clinical outcomes.
Clinical Quality areas within HED allow your organisation to focus on quality of patient care.
HED offers a range of clinical dashboards and modules which offer dynamic drill down functionality to enable users to understand the root cause of potential problems and optimise case note reviews.
Mortality
Monitoring mortality is an essential part of assuring high quality of clinical care. Standardised mortality models are re-run with the most recent national data set every month. HED publishes HSMR monthly and SHMI in monthly and quarterly formats as well as other mortality measures.
Infection Control
Benchmark performance nationally against a variety of factors, including: C. Diff, MRSA, MSSA and E-coli.
Re-admissions
Monitor re-admission rate performance over time and against peers. Compare re-admissions by weekend versus weekday, CCS diagnosis group and treatment specialties.
A&E attendance
Determine the number of A&E attendances in comparison to the number of re-attendances, attendances left before being seen, seen within four hours and time spent before being seen.
Maternity
Monitor a variety of current maternity CQC indicators including caesarean sections and maternal non-elective readmissions within 42 days of delivery.
National Outcomes Framework
View trust’s risk assessment compliance, pulmonary embolism (PE) deaths after hospital discharge and VTE related re-admission rates.
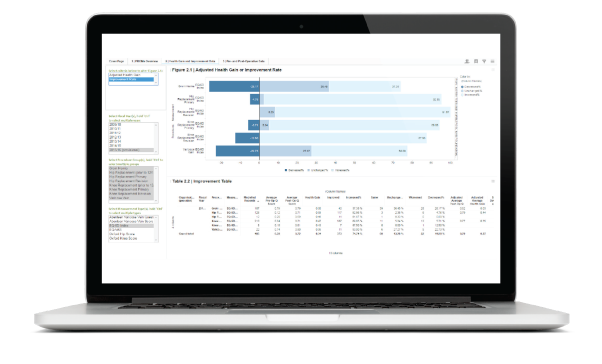
Patient Reported Outcome Measures (PROMs)
View an overview of trust participation and standardised health gain performance for four clinical procedures covering all NHS hospitals in England.
Data Quality
Measure your organisation’s coding depth, eg; comorbidities, diagnosis, of finished consultant episodes in order to review admission patterns and clinical coding quality compared to peers.
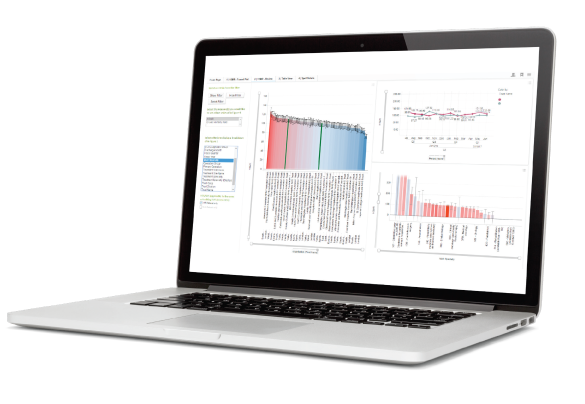
FINANCIAL OPPORTUNITY
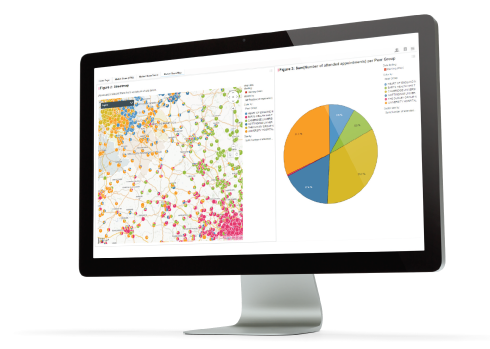
Analysing an organisation’s marketshare is quicker and easier using HED’s range of financial opportunity reporting tools.
An organisation’s marketshare can be viewed by inpatients, outpatients and those admitted by A&E. Reporting tools allow users to benchmark an organisation’s marketshare against regional, national and bespoke peer groups.
Interactive Data
HED utilises interactive data tables which populate in real time with a user’s request. Information can be presented on an absolute and relative basis for the current position of a rolling month, quarter or year relative to the retrospective previous period.
Identifiable Measures
Marketshare measures include, attended appointments, total tariff in-line with HRG 4.0, new appointments, follow up appointments, DNAs and total appointments.
Informed Decision Making
Marketshare modules allow users to benefit from informed benchmarking including patterns for age categories, attendance type, referral source, HRG, CCS Group, ICD10 codes, OPCS Groups, treatment speciality, main speciality and purchaser organisation.
Customisable Elements
HED allows organisations to map their hospital structure to easily identify patterns and growth.
Trend identification
Identify where patients are being referred from. Further to this it is possible to recognise which trust’s patients are going to. Identification can also be used for monitoring local GP practices to ensure your organisation is receiving the marketshare you expect.
Effective Business Strategies
HED Marketshare modules allow organisations to assess business strategies to ensure their effectiveness. This also allows for increased understanding of the healthcare market and the ability to deliver provisions which better support the local population.
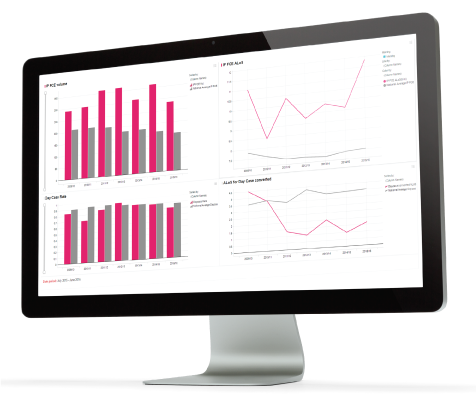
OPERATIONAL EFFICIENCY
HED Efficiency modules are aimed at allowing your organisation to focus on effective use of resources and improving efficiency.
HED Operational areas focus on ways to improve trust efficiency to prevent loss of income meet national targets and effectiveness.
Activity and Finance
View inpatient and outpatient activity in multiple formats with the ability to drill down to perform activity benchmarking and trend analysis. Financial information is aligned to HRG 4.0 national tariff.
Length of Stay
Analyse a variety of LOS options, including; overall length of stay, pre and post-operative, excess bed day usage, and also relative risk LOS analysing patients falling into the upper quartile longstayer category.
Outpatient
Benchmark outpatient non-attendance analysis (DNA), new to follow-up ratios and cancellation rates within NHS organisations.
Readmissions
Measure 2, 7, 14, 28, 30, 60, and 90-day emergency readmissions. Financial information is based on HRG the latest National Tariff and users can drill down to patient ID.
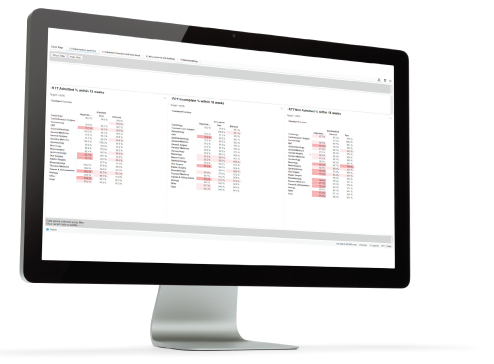
Referral to Treatment Times (RTT)
Measure waiting times from referral to the start of first definitive treatment in weeks at treatment speciality level.
Bed Scorecard
Designed to provide an indication of the bed days that could be saved through the adoption of various methods.
Day Cases
Monitor day case rates and conversion rates over time. Identify areas of good performance and potential areas for improvement and compare conversion rates
with selectable peers.
PATIENT SAFETY
Patient Safety in HED allows users to gain knowledge of key areas and benchmark themselves nationally or against selected peers.
Patient safety covers a wide range of key areas allowing your organisation to focus on improving quality of patient safety.
Metrics are represented in dashboards and modules with user feedback key to effective presentation.
Patient Safety Indicators
HED Patient Safety allows organisations to assess three areas including; deaths after surgery, death in low-mortality CCS groups and obstetric trauma.
Patient Incidents and Outcomes
Analyse the outcome of hospitals compared to the percentage of the incidents. The measures available include mortality, 30 day emergency re-admissions, length of stay, excess bed days, number of beds to be saved and cost impacts.
Patient Safety Incidents
Presents patient safety incidents collated through NRLS data where a degree of harm is recorded as ‘severe harm’ or ‘death’ by provider organisations in England per 1,000 bed days.
Standardised Incident Ratio
Utilising incident reporting data provided through NRLS and correlated HES data this area allows organisations to benchmark standardised incident ratios by month, organisation and treatment specialty.
NHS Safety Thermometer
Metric utilising data from the NHS Digital safety thermometer return. The metric allows users to analyse patient harms covering pressure ulcers, falls, catheters, UTIs and VTEs. Modules allow for national, regional and bespoke peer benchmarking of ‘harm free’ care within all NHS acute and specialist hospitals.
CONSULTANT APPRAISAL
Access consultant specific data related to workload volumes, performance metrics and national indicators
Working closely with consultants, HED has created a range of consultant appraisal reporting metrics.
These online tools allow consultants to benchmark performance with local colleagues and compare nationally.
Consultant Appraisal Report (All Specialties)
Report contains a range of indicators for all activity recorded under a particular consultant. Metrics include inpatient workload volumes, performance indicators, governance indicators, high volume day case procedures, high volume inpatient procedures, outpatient workload and procedure indicators.
Consultant Appraisal PDF
This area is designed to allow consultants to easily export a report containing an overview of their individual performance, trust specialty performance and national specialty performance. Peer performance which details specialist hospitals for both Trauma & Orthopaedics and
Neurosurgery are also available.
Surgical Specific Reports
Surgical specific reports have been designed based on the Royal College of Surgeons (RCS) reporting papers. Covering all the RCS areas; Cardiothoracic, ENT, General, Neuro, Oral-maxillofacial, Paediatric, Plastic, Trauma & Orthopaedic, Vascular Surgery and Urology.
Both types of reporting modules provide an overview of the individual consultant’s performance, the local specialty peer performance and the national specialty peer performance.
The modules give access to the patient records in order to further investigate the data that underpin the metrics.
How to Find Us
Fill up the Form and Ask Your Queries
Address
Level 33, Australia Square
Sydney, New South Wales 2000
Phone
+61 3 0004 7065
info@metishealth.com.au